Looking to maximize your Mega Millions lottery potential? Want to make smarter choices in your Mega Millions play? Our tool provides a detailed breakdown of historical trends, including most common numbers, rare picks, and overdue draws. Discover which numbers appear frequently or are “hot” in recent draws and which ones might be due for a comeback. Use these insights to craft a winning strategy based on data-backed patterns, and increase your chances in upcoming Mega Millions games. How it works
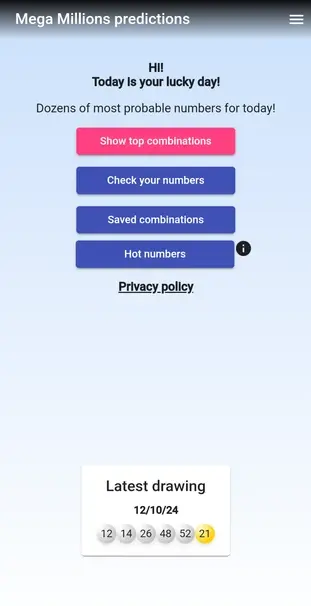
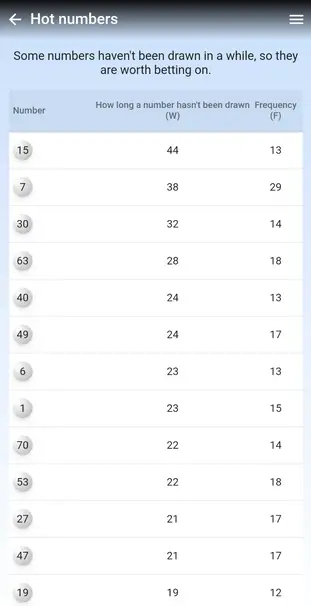
Don't miss a chance to get 100+ most common mega millions numbers for the next drawing. You can always check any combination of numbers and calculate your chances. "Hot" numbers mode reveals the numbers that are worth betting on.
How to Predict Winning Numbers
Our Mega Millions Prediction & Statistics tool provides essential insights for players. It highlights key patterns, such as the most frequently drawn numbers and numbers that haven’t appeared for a while. By analyzing these trends, you can make informed choices that could improve your chances in upcoming draws.
Can mega millions numbers be predicted?
Of course, not. But there are some dependencies that can't be seen unless you take a look at the charts we've prepared for you. Visual representation of any data is always easier to perceive. So let's get into it.
Most Common Mega Millions Numbers
Explore the numbers that come up most often in Mega Millions draws. This section reveals the “hot” numbers that historically show up more frequently,
giving players a better sense of which numbers to consider based on past results.
This chart shows that it's worth choosing among green numbers rather than red, because the frequency of former ones is higher.
Example:
Number 62 (most common number) hits on average every 8 drawings. And number 36(rarest number) comes approximately every 38 drawings.
But, it's interesting that any red number may be most probably in a next draw. How can it be? OK, let's move on to the next chart.
Overdue Numbers
Curious about numbers that haven’t been drawn in a while? Our tool pinpoints overdue numbers, which may indicate those with a chance of appearing in upcoming draws. Use this information to create a balanced number selection. From the previous chart we can see that number 69 hits on average every 24 drawings, but it still hasn't been drawn for 80 times! And it should have been hit 56 draws ago! So, every next draw makes it most likely number.
What is the luckiest number ever?
Next five charts reveal some statistics by number index.
First ball statistics
First ball numbers vary from 1 to 40, so it's worth placing a bet on numbers within this range. The most common(frequent) numbers here are 1, 2, 4.
Second ball statistics
Second ball numbers vary from 2 to 59, so it's worth placing a bet on numbers within this range. The most common(frequent) numbers here are 17, 24, 14.
Third ball statistics
Third ball numbers vary from 4 to 66, so it's worth placing a bet on numbers within this range. The most common(frequent) numbers here are 31, 39, 30.
Fourth ball statistics
Fourth ball numbers vary from 8 to 68, so it's worth placing a bet on numbers within this range. The most common(frequent) numbers here are 48, 43, 62.
Fifth ball statistics
Fifth ball numbers vary from 18 to 70, so it's worth placing a bet on numbers within this range. The most common(frequent) numbers here are 70, 68, 62.
Combination Insights
Our analysis goes further by identifying frequently occurring number pairs or groups, helping you spot potential combinations. These insights offer a broader view of trends beyond single-number stats, giving you additional options to strategize your picks.
Trends Over Time
Check out historical data on Mega Millions draws to identify long-term trends. Whether you’re tracking the frequency of specific numbers or observing shifts over time, this data can guide your strategy and help you pick smarter.
Tips and tricks
Key indicators a player can count on:
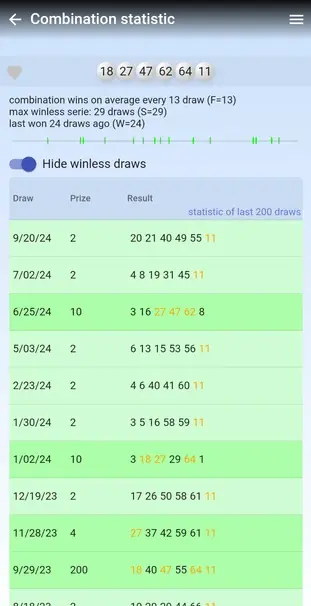
- F - wins Frequency. The lower a value - the better.
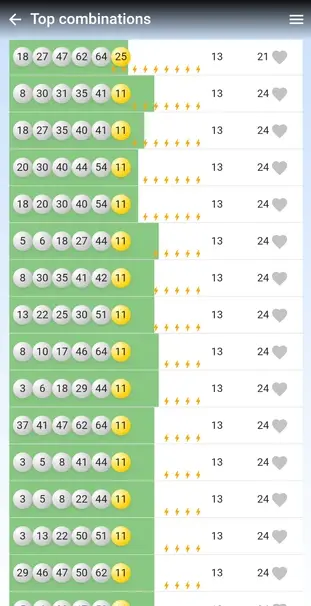
Example: combination {8 30 31 35 41 11} wins every 13 drawings (on average). - W - last Winless series. It's value should be analyzed along with F. The bigger than F, the more chances a combination wins in the next drawing.
Example: combination {8 30 31 35 41 11}, F = 13, W = 24 means the combination wins aprox. every 13 draws, but it hasn't won in the latest 24 drawings. So chances are it wins next time. - The number of lightnings - indicates a number of latest drawings in which none of the combination's numbers was hit.
Example: combination {18 27 47 62 64 25} is marked with 9 lightnings. It means none of the numbers 18, 27, 47, 62, 64 or 25 haven't hit in any of the latest 9 drawings. This is an "overheated" combination.
All of the above indicators might come in handy in a process of picking the one and only lucky combination, or several ones.
Screenshots


 Online Service tools
